
Replacing a faulty submarine cable can be extremely costly (potentially over 100 million US dollars), so the typical design is built to last for over forty years. To ensure a good return on investment, the industry typically acts on the conservative side: relying heavily on rules of thumb, safety margins, life-cycle analysis, and standards such as those provided by the International Electrotechnical Commission (IEC). However, these margins and standards tend to result in an overestimation of the required dimensions and materials. In a competitive market, cable suppliers are looking for more cost-effective solutions.
Note that in this blog post, we go over the final two parts of the 8-part Cable Tutorial Series, which focus on 3D cable modeling. The series discusses many aspects of cable modeling — in 2D, 2.5D, and 3D — using COMSOL Multiphysics® and the AC/DC Module. The first six parts of the tutorial series have been showcased in a previous blog post: Modeling Cables in COMSOL Multiphysics®: An 8-Part Tutorial Series.
Rapidly Advancing Capabilities in Cable Modeling
Just a few years ago, detailed 3D cable models were available only to experts running dedicated codes on large cluster systems. Nowadays, anyone with access to a modern desktop computer is able to run a 3D cable model with twisted magnetic armor in about half an hour. The geometry handling, meshing, solving, and postprocessing are all done within the user-friendly desktop environment of the COMSOL Multiphysics® software.
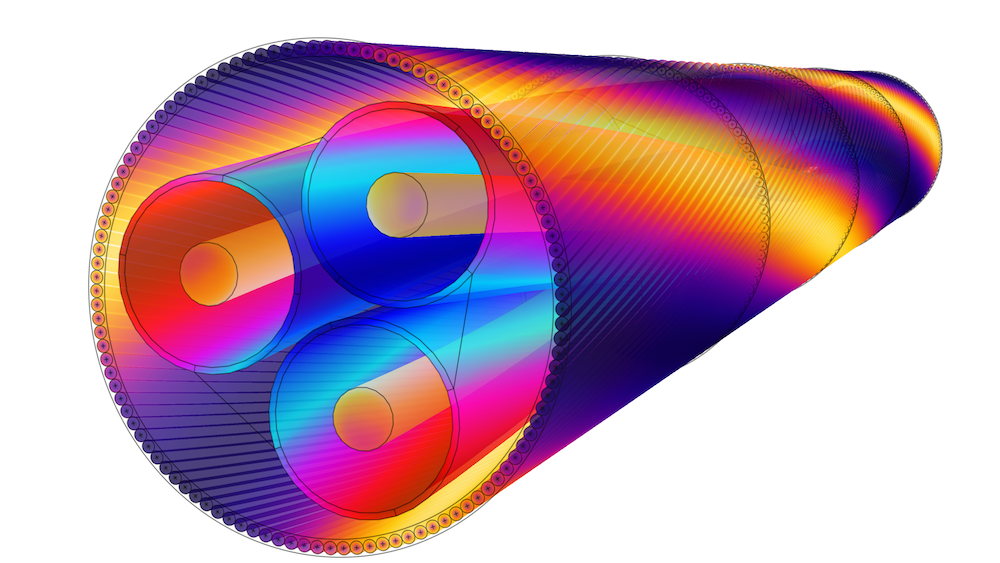
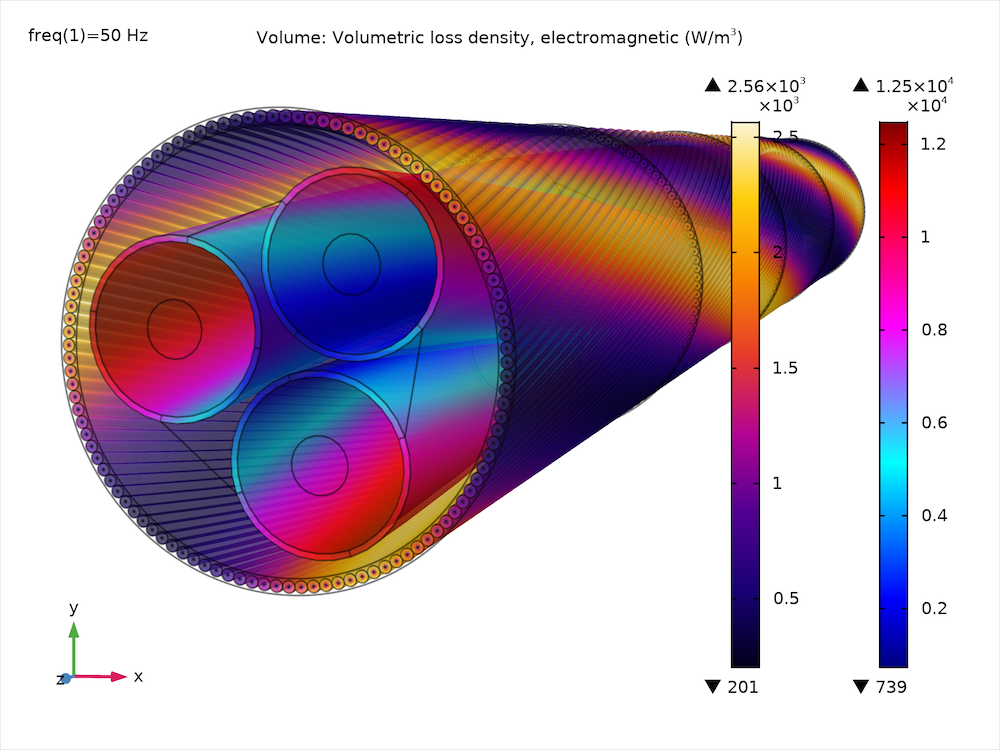
The resistive and magnetic loss density in the phases, screens, and armor of a three-core lead-sheathed XLPE HVAC submarine cable at a nominal phase temperature of 90°C.
Consequently, in the power cable industry, 3D cable models are slowly replacing empirical models such as those provided by the IEC series of standards. For typical use cases, these standards allow manufacturers to meet certain specifications. For users of cable systems, they allow for assessing the required operating conditions, the resulting system limitations, and so on.
While the standards rely on empirical models and decades of experience, numerical models actually solve Maxwell’s equations in full detail. The obvious advantage is that it allows for investigating devices for which there is no official standard. Furthermore, numerical models provide a means to get a detailed insight in the physical phenomena at play, and so go beyond the standards. This will allow for cutting down on material and manufacturing costs and increase system efficiency, while still keeping a sufficiently large safety margin. Within the competitive cable market, numerical analysis is considered a vital asset.
Geometry and Meshing Considerations for 3D Twisted Cable Models
For large 3D FEM models, setting up the geometry and mesh can easily take up the majority of your modeling time — that is; your man-hours, not your machine-hours — especially for twisted cable models with separate lay lengths, like the one featured here. Even when using twisted periodicity conditions, the geometry will include extreme aspect ratios. This means that if you would just use a general-purpose, isotropic, free tetrahedral mesh, the amount of degrees of freedom (DOFs) would easily rise to over thirty million!
An iterative solver might be able to handle this without too much memory consumption, but finding one that can reliably and efficiently solve the model is easier said than done. Using a direct solver proves to be a better option, but for it to work smoothly on reasonably cheap hardware — like a desktop machine with 32 GB of RAM and several hundred gigabytes of SSD swap drive capacity — the DOF count will need to be lowered to about 2–4 million. Fortunately, direct solvers are more forgiving than iterative ones when it comes to anisotropic meshes.
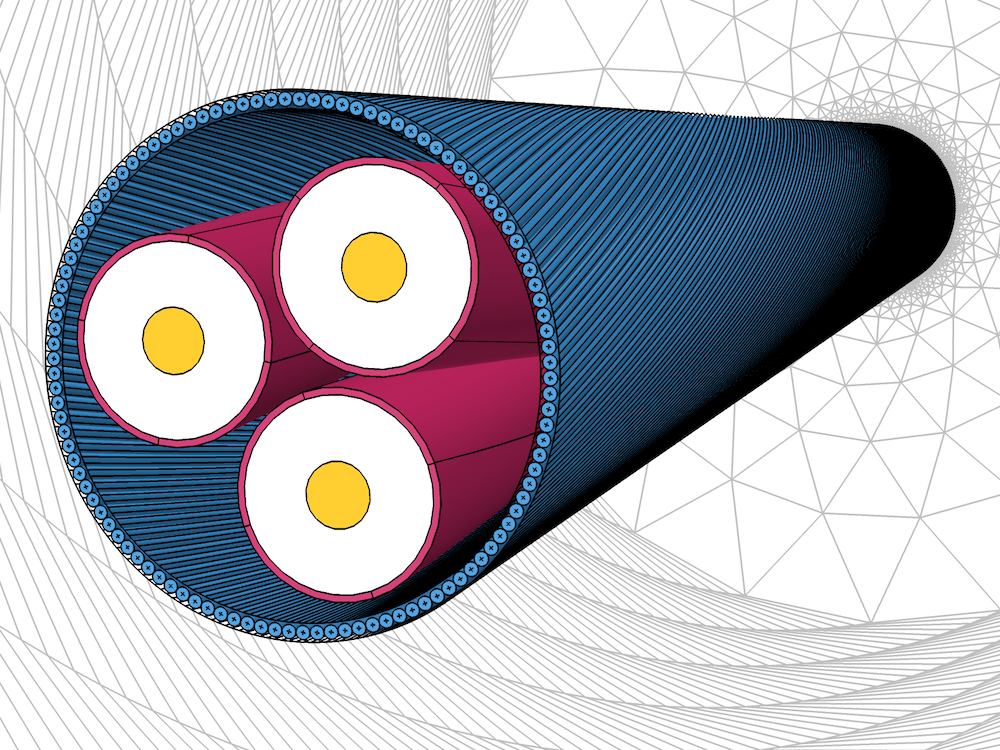
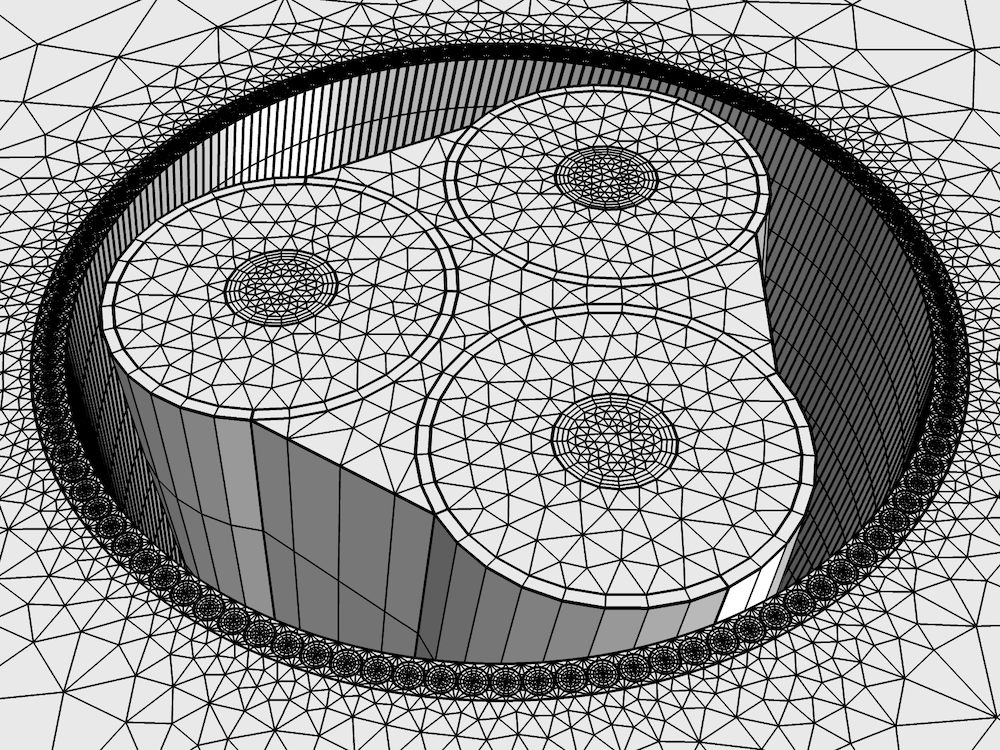
Left: The 3D geometry of a three-core lead-sheathed cable with twisted armor. Right: The swept mesh in the phases, screens, and armor (the void region between the screens and the armor uses a stretched tetrahedral mesh).
Consequently, the challenge is to find a mesh that can properly resolve the cable geometry and the physics, with a DOF count low enough so that the model can be solved in a reasonable amount of time on an average desktop machine. The Geometry & Mesh 3D tutorial (Part 7 of the tutorial series) shows you how to tackle this challenge efficiently. The tutorial discusses various geometry- and meshing-related topics, including how to:
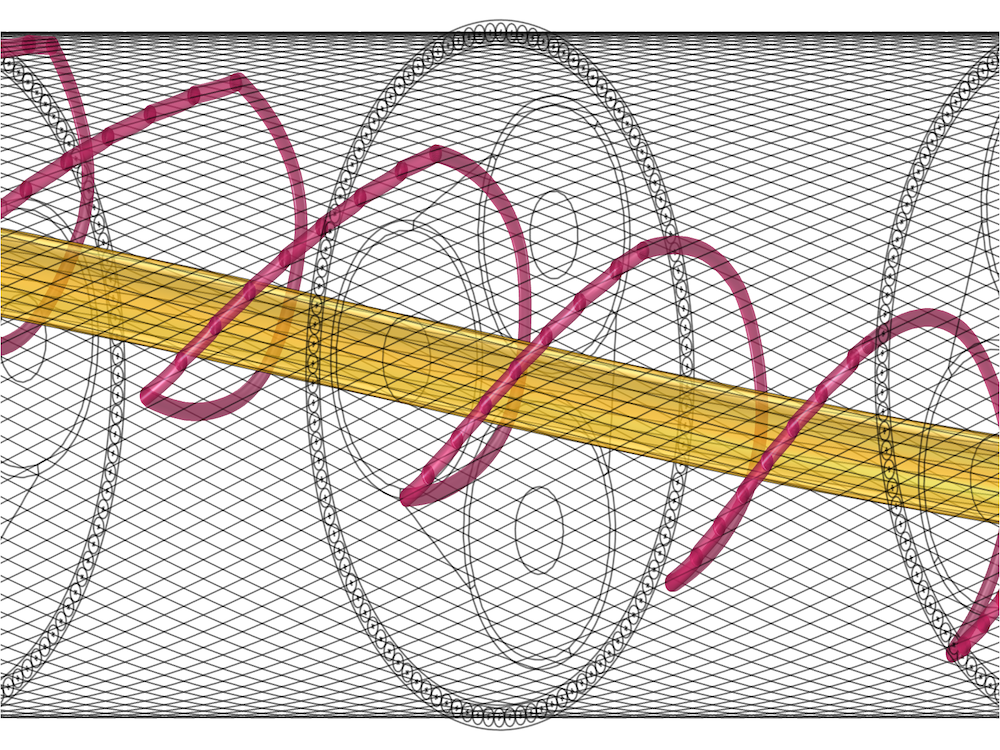
- Create the helical conductors using the COMSOL geometry sequence
- Make use of clever selection filters for the domains and boundaries to greatly ease the model setup
- Set up an efficient and robust meshing strategy
When setting up the geometry, geometrical correction factors are used, such as slant- and truncation correction factors. This is to get the best possible accuracy for the least amount of computational effort. Furthermore, swept meshes are discussed, as well as stretched tetrahedral meshes, boundary layer meshes, and mesh conformity.
Using 3D Models to Investigate Inductive Effects in a Submarine Cable
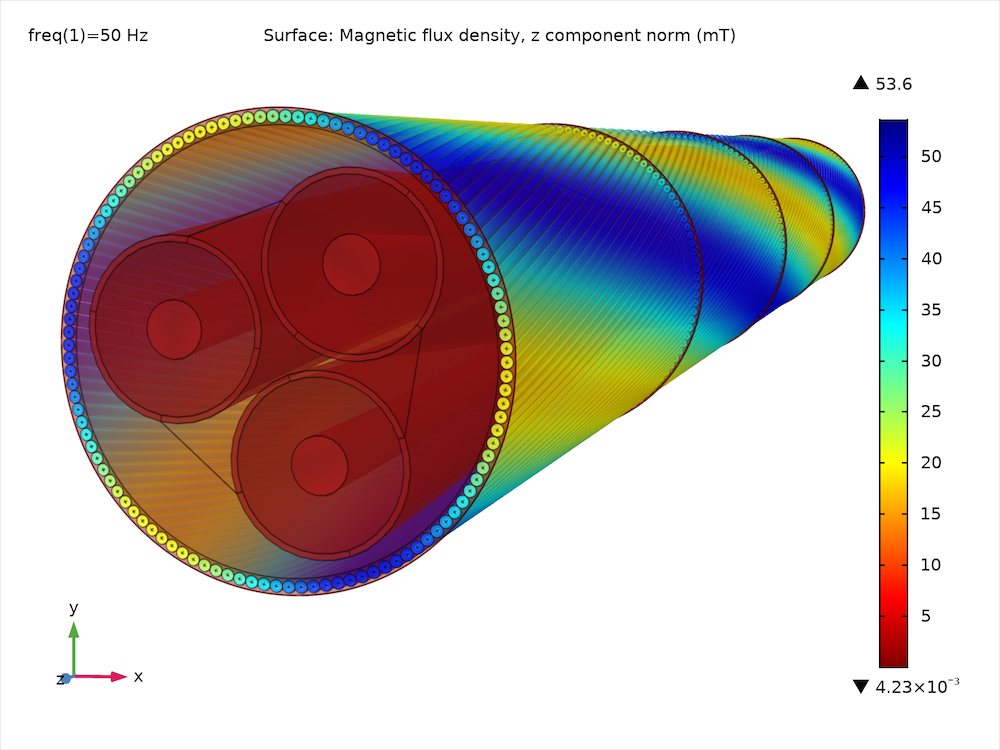
The Inductive Effects 3D tutorial (the final part of the series) gives you a comprehensive overview of the topics involved when modeling a XLPE HVAC submarine cable in 3D. Although 2D and 2.5D models are very valuable for cable engineering, they cannot capture the precise, intricate interactions between the phases, screens, and armor the same way that a 3D model can. Why? Typically, the phases and armor are twisted with different lay lengths, in opposite directions. The opposite twist causes the magnetic flux density to develop a longitudinal component in the armor: The magnetic flux will follow a helical path, rather than a circular one (see image below). This phenomenon — and related effects — can only be investigated using full 3D twist models.
Left: The path taken by the magnetic flux lines (they follow the armor wires for a certain distance, and hop from wire to wire). Right: The resulting longitudinal magnetic flux density.
Now, let’s go over some of the topics discussed in part 8 of the Cable Tutorial Series…
The Extruded 2D Model
This section explains how to build a 3D cable model that should be completely equivalent to the 2D one: A plain extrusion, without twist. At first glance, the exercise may not seem useful, but it actually provides you with a great deal of information! The 3D model has been heavily simplified as compared to the 2D one, and uses first-order shape functions instead of second-order ones (meaning the solution will be piecewise linear instead of quadratic). These measures are necessary to keep the 3D model manageable, but they come at a cost. By creating a 3D model that should — in theory — produce the same results as the 2D one, you can investigate the effect of the used simplifications. It provides you with a lower bound of how accurate the 3D models really are (around 0.2–0.5%), without even the need for an actual measurement (those come with a limited accuracy too, by the way).
Another big advantage of this modeling step is that it allows you to test your model before going full-scale: Since at this point, the geometry is not twisted, there is no specific length required to follow the twisted periodicity. While the twisted model will need to have a length equal to the cable’s cross pitch, the extruded 2D model is chosen to be ten times shorter. It solves in a minute rather than half an hour, helping you to quickly do some tests and sanity checks. When done, the fully parameterized geometry will allow you to proceed to a full 3D twist geometry at the flip of a switch.
It is a good modeling practice to test and validate your models at a small scale (preferably 2D), before going full-scale. You should first convince yourself that your numerical simulation is robust, efficient, and accurate enough to serve its purpose. Already at that stage, you will learn a lot about the basic behavior of your device — and where to cut costs, for example. After that, you can easily take your models beyond the point that you can cover with ordinary prototypes or measurements, including parametric sweeps and automated optimization.
The 3D Twist Model
With the twist included, you enter a different level of cable modeling. First of all, you will need to have the right kind of periodicity. The periodic length of the cable is determined by the lay length of the phases and the armor (in this case, it is about 1.6 meters). The periodicity is not a straight projection from one periodicity plane to another, though. Instead, it includes a twist. The cable’s straight (untwisted) periodicity may be as much as forty meters! This is why the twisted periodicity has been a reoccurring topic in recent cable papers.
Animation of the phase currents, screen currents, armor currents, armor flux, armor losses, temperature distribution, and mesh structure.
Now, the cable’s behavior changes. The magnetic flux develops a longitudinal component in the armor, and the induced armor currents develop small eddies encircling the armor wire’s centerline. The twist suppresses the total longitudinal current per armor wire to zero, but it does not constrain the currents locally. Consequently, the currents will flow in the positive longitudinal direction on the inside of the armor (where the phases and screens are), and flow back on the outside (where the electromotive force from the phases is weaker). This effect is successfully reproduced by the 2.5D models shown in Part 4 of the series. The circular eddies, however, can only be seen in 3D.
The transverse currents form eddies in the cross section of the wire (the cones); the longitudinal currents flow back and forth and are zero on average (the gradients).
Linearized Resistivity in 3D
Thermal effects are an important part of cable modeling. Submarine cables typically operate at temperatures around 80–90°C, and the cable’s material properties are temperature dependent. A very efficient way to deal with thermal effects in 3D is to take the temperatures from a 2D induction heating model (as demonstrated in Part 6 of the series) and use those to specify your temperature-dependent material properties in 3D. This can be seen as a first-order temperature correction. If you like, you can repeat the procedure:
- Compute the average phase-, screen-, and armor losses in 3D
- Use those as a heat source in a 2D thermal model
- Solve for the temperature, and…
- Use the average phase-, screen-, and armor temperatures to update your material properties in 3D
In COMSOL Multiphysics, you can even go for a fully coupled, hybrid 3D/2D induction heating model if you like — or a full 3D one, for that matter. Either way, you will find that the temperatures converge very quickly: The first-order temperature correction is more than enough in most cases. It reduces an initial error of about 10–20% to as little as 0.2%.
| 2D Fully Coupled Induction Heating | 3D Twist Model (No Heating) |
3D Twist with First-Order Temperature Correction | |
|---|---|---|---|
| Phase Losses (kW/km) | 58 | 48 | 59 |
| Screen Losses (kW/km) | 11 | 18 | 15 |
| Armor Losses (kW/km) | 6.8 | 2.8 | 2.8 |
| Phase AC Resistance (mΩ/km) | 59 | 53 | 59 |
| Phase Inductance (mH/km) | 0.43 | 0.44 | 0.45 |
Results from the 3D twist model with first-order temperature correction, as compared to the 3D twist and 2D fully coupled induction heating models.
The change in resistivity causes the cable to rebalance itself. The active conductors are current driven, causing the local losses to increase. The passive conductors are voltage driven, however, causing the local induced currents and losses to decrease. In addition to this, there are a number of waterbed effects. To illustrate: Due to the reduced eddy currents in the armor, the magnetic flux penetrates the armor wires more easily, and the magnetic losses increase. At a nominal phase temperature of 90°C, they comprise about 75% of the total armor losses.
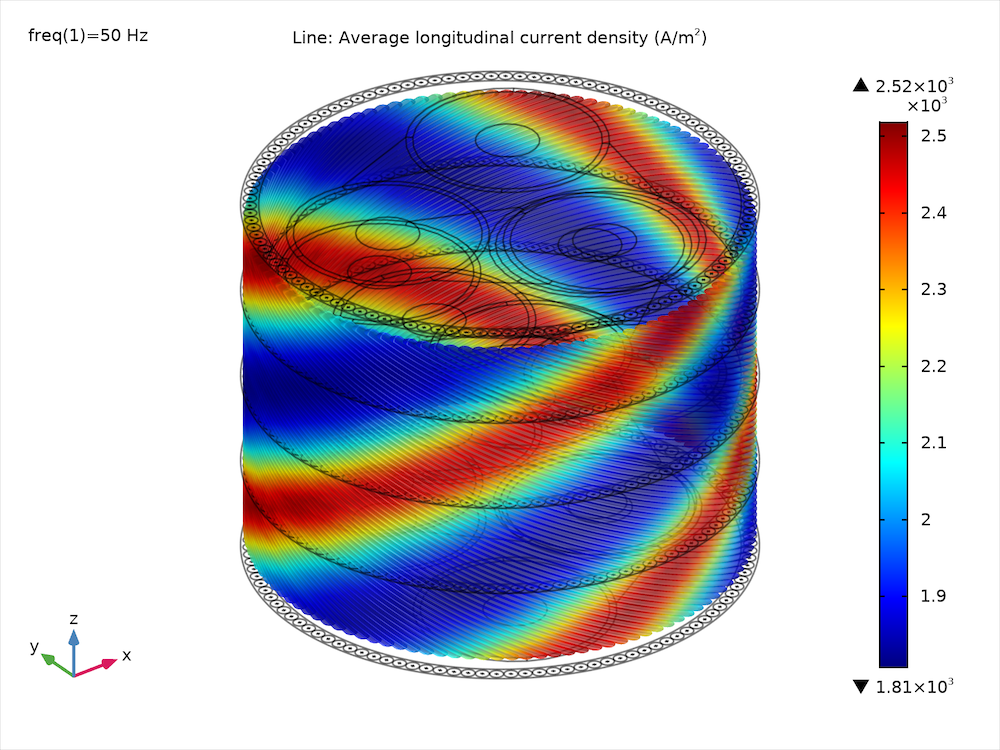
Left: The volumetric loss density in the armor and screens after applying a first-order temperature correction. Right: The average longitudinal current density in the armor, before applying the compensation term.
Compensated Stabilization
Electrical conductivity is likely to be one of the material properties with the largest range of naturally occurring values. The cross-linked polyethylene (XLPE) in the cable has an electrical conductivity with a value around 1e-18 S/m, while the copper has a value of 6e+7 S/m — a contrast of 6e+25! In order to keep the model numerically stable, the insulators are given an artificial conductivity of 50 S/m. For an inductive model like this, 50 S/m turns out to be a perfectly reasonable approximation of zero (giving a good “insulator”) — just as for capacitive models, 1 S/m may already give a good approximation of a “conductor” (for more on the capacitive properties of the cable, see Part 2 of the tutorial series).
In order to demonstrate that 50 S/m is a reasonable value, the model is solved using a procedure that compensates for the resulting current leakage. First, the total longitudinal armor currents (integrated over the armor wire’s cross section) are evaluated to show there is indeed a leakage between the wires (see image above). Then, the model is solved a second time. The second time, an artificial current is added that is equal to “minus the leakage” (a bit like installing a pump, to compensate). As a result, the artificial insulator losses go down from 0.1 kW/km (which is already insignificant compared to the overall loss) to 0.0002 kW/km. Just like higher-order temperature corrections, this procedure can typically be omitted. Still, it is a useful tool if you wish to do some additional verification.
Note: These insulator losses are related to numerical stabilization. They are different from the typical tan(δ) dielectric losses used in capacitive models. Also note that alternative numerical approaches are available that do not require this amount of stabilization. Those will typically require much more computational resources though, giving you a less cost-effective workflow. So the goal is not to have a model that is as accurate as possible, but to have a model that gives you a good return on investment.
Additional Ways to Use the Cable Tutorial Series
Believe it or not, the Cable Tutorial Series is not just “all about cables” — It is about electromagnetics and numerical analysis, good engineering practices, understanding and applying theory, validating results, and presenting your results to be both visually appealing and informative.
The example of the three-phase cable with twisted magnetic armor is ideal for illustrating various electromagnetic and numeric phenomena in courses given at the university, or within the industry. Many cables are standardized, which means their physical properties are available from literature, allowing you to validate your modeling results. At the same time, cables are subject to ongoing research, which makes them an intriguing subject for engineering students and academic students alike.
Next Steps
Try out the 8-part Cable Tutorial Series by clicking the button below. You can skip to parts 7 and 8 to study inductive effects in the 3D cable model.
Read about parts 1–6 of the tutorial series here: Modeling Cables in COMSOL Multiphysics®: 8-Part Tutorial Series



Comments (5)
Jean-Marc Petit
July 31, 2020 COMSOL EmployeeGreat blog ! Explanations are worthfull. Thanks !
Chesca Bogdan
April 19, 2021Hello,
Excuse me for bothering you, I am a student at the Faculty of Electrical Engineering at the Politehnica University of Bucharest, Romania.
I participated at the Comsol Webinar on Thursday and I have some questions about a problem that I am studying and I would be grateful if you could answer me.
I want to study the effect of eddy currents and the skin effect for a conductor from overhead power line composed of 26 aluminum conductors and 7 steel conductors which is traversed by a sinusoidal current of 320 A amplitude and 50Hz frequency. The length of the conductor is 10 cm and I framed it in an air domain.
1. Can these effects be studied in 2D?
2. For the 3D model I don’t know if the mesh definition is correct because after the simulation, I get an error (Failed to find a solution, Divergence of the linear iterations, Not all parameters steps returned). I have COMSOL Multigraphs 5.3a and an 8Gb RAM computer. Do I have to simulate on a better PC?
3. In the second part of the study I have to replace 4 aluminum conductors with a nonlinear magnetic material that has a specific magnetization curve BH. I know how to enter the function f (B) = H but when I choose constitutive relation (effective BH curve) and for aluminum conductors requires me to magnetization curve BH, but aluminum is linear. The error is describe below:
4. Do you know how to twist this conductor? I would like to twist the 3d model as in the picture
5. Is it possible for a student to obtain a free version of Comsol 5.6?
Durk de Vries
April 20, 2021 COMSOL EmployeeHi Chesca,
Thanks for contacting us.
First of all, we recommend to contact COMSOL support (support@comsol.com) if your license supports it. It may be you need to go through your professor to access COMSOL support.
That said, I can give some general answers:
1. If the power line is long (the conductors are pointed in the same direction) and you wish to make a 1st-order investigation of the electrostatic environment (and stray magnetic fields), a 2D model is a good start. A short piece of power line in 3D (with periodic conditions) should work too. If you have some kind of transformer station with cables going in all directions, a 2D model will be less valid.
2. For this, it would be better to take it through support, then we can have a look at it. If this is a classroom exercise I can understand your machine is limited to 8GB. If you are doing a PHD and this is part of your research, I would argue upgrading to 16 or 32GB gives a good return on investment. Finding ways to do it with 8GB is more costly, especially if you wish to go for industrial scale modeling.
3. For this too, it is better to take it through support. Generally speaking, you can use an ordinary BH curve for stationary and transient studies, and for frequency domain studies you can use an effective BH curve. In that case, you will have to preprocess your measured BH curve with a tool such as: https://www.comsol.com/model/effective-nonlinear-magnetic-curves-calculator-30941
4. I am unable to see the picture if you have attached one. If you’re referring to a picture in the blog, the typical approach for an overhead power line is to model a short piece of one of the cables in detail (including the twisting scheme), to investigate how the twisted strands affect the skin effect for example. You can also just do with a bulk conductivity: If you have measured values of the frequency dependent resistance per meter, that will already include the effects of the twisted strands, for example. It probably does not include the effects of nearby conductors.
5. I would take that through your professor. For the research you’re doing, COMSOL 5.3a should be sufficient I think, especially if you’re willing to make some custom modifications in the equation view and the solvers.
Chesca Bogdan
April 29, 2021Thank you very much for your support. I managed to advance with the modeling of this conductor but the problem I haven’t solved yet is how to build the mesh.
I don’t want to bother you, but is it possible to attach you somehow in private the model created by me and tell me where I’m wrong when I generate the mesh?
Have a nice day!
Brianne Christopher
April 29, 2021 COMSOL EmployeeHello Chesca,
Thank you for your comment.
For questions related to your modeling, please contact our Support team.
Online Support Center: https://www.comsol.com/support
Email: support@comsol.com
Best,
Brianne