Performing a Sensitivity Analysis UQ Study
Here, we will demonstrate how to perform a sensitivity analysis in the COMSOL® software, using the built-in Sobol method in the Uncertainty Quantification Module. The screening analysis performed in Part 2 of this course identified the side length (ls) and cross-plate width (wp) as the most influential parameters affecting the quantity of interest, the misalignment angle. Since sensitivity analysis is more computationally intensive than screening, it is typically recommended to focus on a subset of the parameters identified during the screening phase. However, in this example we aim to gain as much insight as possible into the model, so we will include all of the design parameters considered in the screening study.
While screening is used to qualitatively rank the significance of input parameters, sensitivity analysis using the Sobol method quantifies the contribution of each input parameter to the variability in the model output. This method enables you to identify which parameters have the most significant impact, both individually and through interactions with other parameters. By understanding these influences, you can prioritize computational resources, optimize designs, and make informed decisions to enhance model performance and reliability.
Sensitivity Analysis
When moving from screening to sensitivity analysis, there is no need to reenter all of the UQ parameters. Instead, you can define the new uncertainty quantification study for a sensitivity analysis by reusing the information from the screening study. The result of the sensitivity analysis will be a set of Sobol indices, along with an associated Sobol table and Sobol plot, which we will discuss later in this article.
Open the Model and Add the Study
To begin a sensitivity analysis for the bracket model discussed previously, start by opening the model file that includes the UQ screening and static structural analysis from Part 2. Save the file and rename it to bracket_uq_static_structural_and_sensitivity_analysis.mph.
To add a new study with the sensitivity analysis, right-click Study 2 > Uncertainty Quantification and select Add New Uncertainty Quantification Study For Sensitivity Analysis, as shown in the figure below. This step generates a Study 3 node that has the new study available.
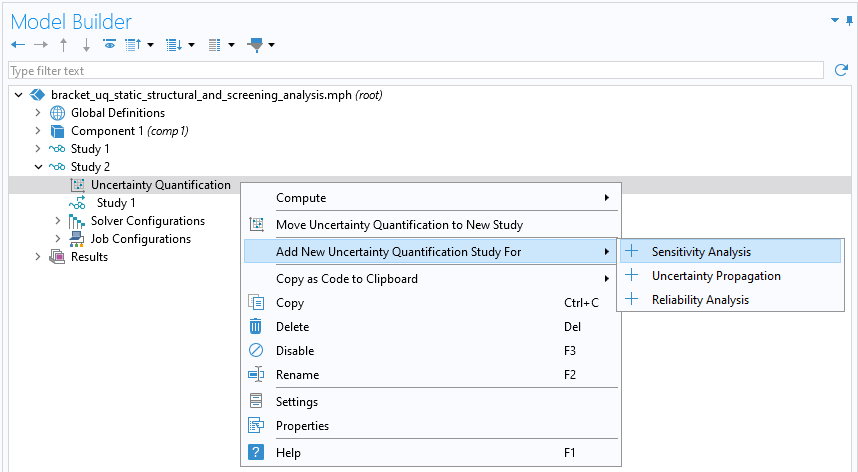 A screenshot of part of the model tree with the Uncertainty Quantification study node selected and the respective menu options expanded.
Adding the UQ study type for a sensitivity analysis.

Study 3 is the second uncertainty quantification study. This study has the sensitivity analysis option enabled.
The UQ study type selection in the Settings window for the Uncertainty Quantification study is now set to Sensitivity analysis. The settings for the Quantities of Interest and Input Parameters sections are all copied over from the screening study and do not have to change, as shown in the figure below.

The sensitivity analysis settings for the Uncertainty Quantification study.
To accelerate the sensitivity analysis, this UQ study type uses a surrogate model, specifically an adaptive Polynomial Chaos Expansion (PCE) surrogate model. A PCE surrogate model represents the uncertain parameters of a system as a series of orthogonal polynomials, which are chosen based on the probability distributions of the input variables. This model provides a direct method for computing Sobol indices for use in a sensitivity analysis. During the Sensitivity Analysis study, the creation of the PCE surrogate model is automated, ensuring that the model is solved a minimal number of times. After computation, the surrogate model becomes available under Global Definitions. In this case, the surrogate model defines a single PCE function that can potentially be reused for other purposes through a function call.
During the computation, the input parameter space is sampled using a Latin-hypercube-sampling-based design of experiments method. The PCE surrogate model is adaptively improved during this process until either the tolerance or the maximum number of sample points is reached. You can learn more about the PCE surrogate model type and sensitivity analysis in the surrogate modeling course part on creating a PCE surrogate model from imported data, as well as in the surrogate modeling theory course part on PCE surrogate models.
Run the Simulation
To begin the sensitivity analysis computation, right-click the Study 3 node and select Compute. The computation takes about 10–20 minutes, depending on the hardware. The default plot is a Sobol plot, as shown in the figure below.

The Sobol indices from the sensitivity analysis of the steel bracket showing the influence of each input parameter.
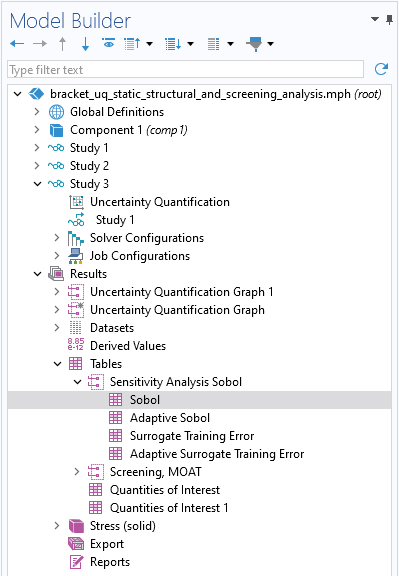 A UI screenshot of the model tree with the Tables node under Results expanded and the Sobol node selected.
 A screenshot of the Messages/Progress/Log window section of the COMSOL Multiphysics UI with the Sobol results table displayed.
The node in the model tree (left) for the table of Sobol indices (right).
Visualize and Analyze the Results
In this case, the sensitivity analysis uses the Sobol method (also referred to as a variance-based sensitivity analysis). The results include a set of Sobol indices, along with an associated Sobol table and Sobol plot. There are two types of Sobol indices: the first-order index and the total index. The first-order Sobol index measures the contribution of a single input parameter to the (output) variance for the quantity of interest. The total Sobol index measures the overall contribution of an input parameter to the output variance of a quantity of interest, including both its individual effects and its interactions with all other input variables. It is a composite sensitivity measure that accounts for the complete influence of a particular input parameter on the output.
In this case, the first-order and total indices are nearly equal, indicating that the contribution of the parameters to the overall sensitivity are primarily independent, with minimal interaction between the parameters. For a more thorough discussion of Sobol indices, see the surrogate modeling theory course part detailing more on PCE surrogate models, sensitivity analysis, and Sobol indices.
The Sobol plot reveals that the misalignment angle is most sensitive to the side length and cross-plate width parameters, which is consistent with the screening results. For the next two studies covered in this course — uncertainty propagation and reliability analysis — we will focus only on the side length and cross-plate width parameters for the purpose of a faster demonstration. However, to obtain a more conservative estimate of the uncertainties, all parameters would ideally be included in these subsequent analyses.
Further Learning
For a more thorough discussion of Sobol indices, see the surrogate modeling theory course part detailing more on PCE surrogate models, sensitivity analysis, and Sobol indices.
Submit feedback about this page or contact support here.